.webp?width=600&height=150&name=Pennington%20Choices%20Logo%20(reduced).webp)

.webp)


Speak to our team
Looking for support with ensuring the safety and compliance of your buildings? Get in touch with our team of experts.

Share this article
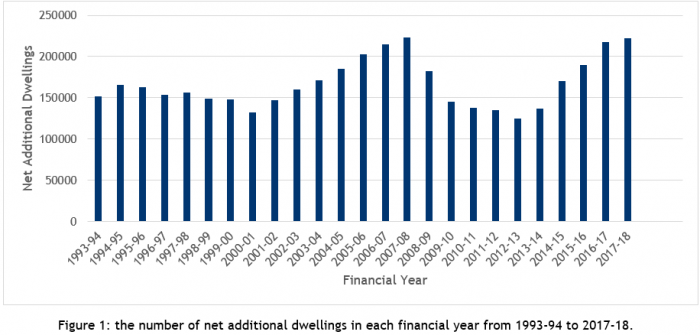
The net additional dwellings statistics presents data related to the number of new dwellings estimated to be gained or lost between 2017-2018 in England. Local Authorities release the data estimates for their area on an annual basis using a broad list of sources that make it the most comprehensive measure of housing supply in England. The data can be used to deliver a complete picture of housing in England and align current supply with future housing requirements.
The net additional dwellings data shows that the estimates for 2017/18 are just 1% below the peak found in 2007-08 and 78% higher than the lowest ever value in 2012-13. Figure 1 highlights the variations in dwelling stock since 1991-92 and the current position of the housing sector, whereby net additional dwellings is up 2% on 2016-17, as part of a 5 year period of continual increases. The clear trough in 2012-13 can be explained by the economic downturn, which has been followed by a steady increase in net additional dwellings as economic markets have recovered. The current trend suggests that the peak value of 223,530 dwellings in 2007-08 will be achieved in the next data release if the current trend continues.
What does this mean for the housing sector?
The changes in net additional dwellings highlight the positive changes that are occurring within the housing sector. Net additional dwellings data is the primary measure of housing supply, therefore the publication shows that the UK are seeing an increase in housing stock. Net additions have this year increased to 222,190 properties, an increase of 2% on 2016-17 and this provides assurance that future housing construction will come closer to meeting the demand in communities for housing.
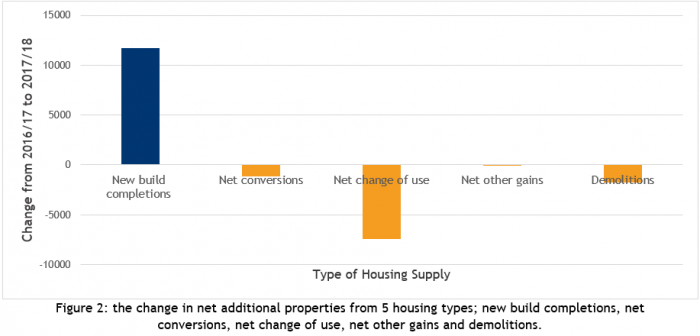
The 2% rise in net additional housing that has occurred in the past year has not been contributed to equally by all housing tenure types. Figure 2 clearly highlights this disparity, with new build properties increasing by 11,720 units from 2016-17, equating to an 88% net increase. Alternatively, homes that were formed from a building change of use, such as a shop or barn conversion, reduced by 7470 units since last year.
What does this mean for the housing sector?
Some have suggested that the sharp increase in new build properties has been motivated by the Help to Buy government-housing policy. However, the end of this scheme in 2022 could therefore mark the end of the 5-year continuous rise in net additional dwellings. It is therefore vital to understand what has motivated the rise in housing provision, in order for the increase to continue and government targets to be met. If the Help to Buy scheme has in fact strongly contributed to the increase in net additional housing supply, then the end of this scheme could mean an end to housing supply increases.
The statistics related to net additional dwellings in England are demonstrative of a housing sector that is well positioned to achieve the housing targets set out by government to achieve one million homes by 2020. The estimated 2% increase in net additional dwellings within the next year is a positive addition to the past 5 years of increases. However, there are concerns that the future of housing supply is at risk when policies such as the Help to Buy scheme end. The introduction of alternative policies as replacement of the Help to Buy Scheme may remove the risk of a fall in housing supply and help to close the gap between supply and demand.
The full net additional dwellings report can be found here.