Sign up to our newsletter
The Registered Providers Statistical Data Return is produced annually by the Regulator of Social Housing. The purpose of the document is to identify the overall position of the sector and subsequently assess the major risks facing registered providers in order to allow an in depth sector wide value for money analysis to be undertaken. The statistical data is particularly useful for understanding the current position of the social housing sector, since 95% of PRPs are represented, allowing for an in-depth understanding of the social housing market and the environment in which it operates.
1. Private Registered Providers (PRPs) have increased the amount of social housing stock that they own.
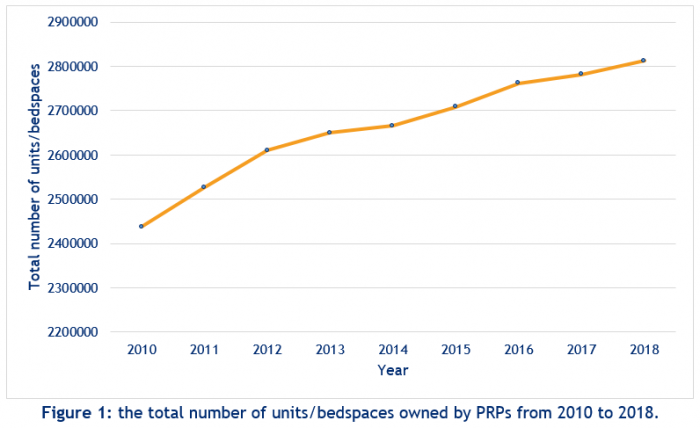
PRPs have increased the amount of social housing stock that they own, with a 1.1% increase since 2017, the highest percentage growth rate since the statistical data was first made available in 2010. In comparison, the increase in the number of units owned from 2016 to 2017 was just 0.6%, meaning that the increase has almost doubled in just one year. Figure one displays this clearly, with 2,812,320 units/bedspaces in 2018, an increase of 31,015 units/bedspaces since 2017, a notable rise for just a one-year period.
The 1.1% increase in the number of social housing units owned by PRPs can be somewhat explained by the changes to government funding for affordable housing. The 2016-2021 Shared Ownership and Affordable Housing Programme (SOAHP) and the Greater London Authority’s Affordable Housing Programme (AHP) have both jointly contributed to the increase in affordable housing development. Both schemes have been in place for two years, which is enough time to see the completion of a large number of new homes within the sector, and subsequently an increase in the number of units/bedspaces owned by PRPs. It is important to note that deliverance of housing stock was adjusted, at the end of 2016, away from predominantly shared ownership scheme funding and towards affordable housing provision. This restructuring will have also added to the 1.1% increase in social housing units owned in 2018.
 2. Between 2017 and 2018 there was the highest amount of units transferred into providers stock ever recorded.
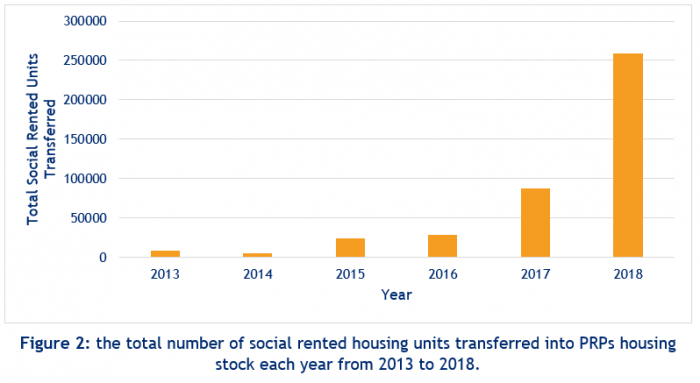
As displayed in Figure two, between 2017 and 2018 there was a record number of units that were transferred into large PRPs social housing stock. The number of transferred units was up by 170,743 units in 2018, a percentage increase of 195% in one year. The record-breaking volume of transfers can be explained by significant group restructuring within the sector, particularly through mergers. The data includes transfers of stock within the social housing sector as well as stock transferred from outside the sector, such as from Local Authorities. An interesting point acknowledged in the Statistical Data Return is that one provider was responsible for 39% of all the transfer activity during the past year, therefore the significant increase does not necessarily mean that mergers and restructuring is happening within every organisation, it may be that a small number of PRPs mergers are responsible for the increase. Mergers are becoming more common within the housing sector as the operating environment is faced with budget cuts, government reform, and rent reduction. Mergers offer a potential solution for some providers, in light of financial struggle, to improve Value for money and reduce overall financial costs. This may explain the year on year increase in social rent unit transfers since 2014.
 3. There has been a significant increase in the number of for-profit providers within the social housing sector.
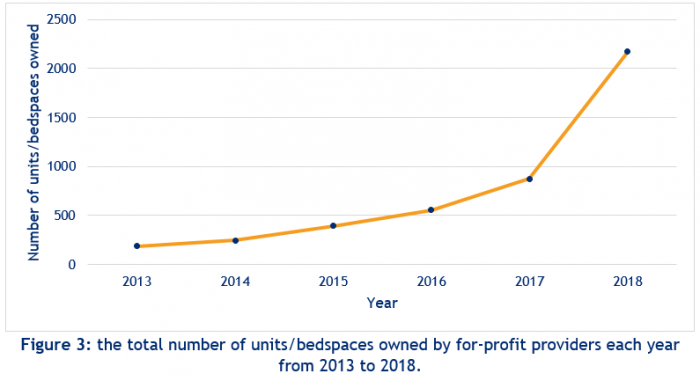
There is currently the largest number of for-profit registered providers in the social housing sector (37) than ever before and this is made most visible in Figure three, whereby the number of units/bedspaces owned by for-profit providers has reached its highest value (2171). Since 2017, the number of for-profit owned units/bedspaces has risen by 148% (1298), the highest rate since data collection of this kind began in 2013.
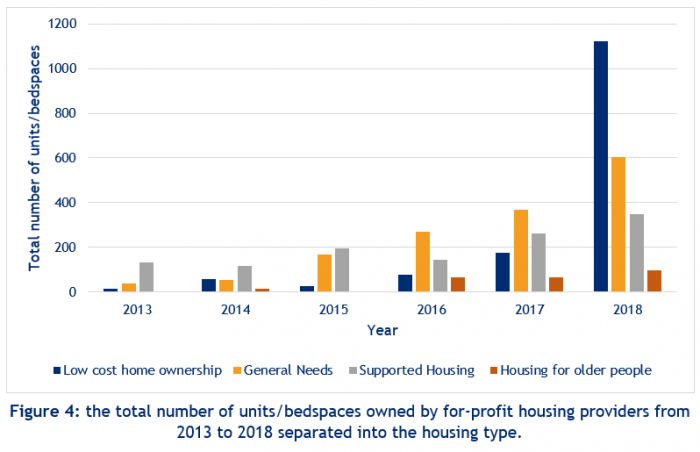
Figure four breaks the increase down into the type of housing acquired by for-profit providers. It is clear that low cost home ownership overtook general needs in 2018 as making up the highest proportion of social housing stock. Low cost home ownership increased by 537% since 2017 and now surpasses the number of general needs units. The Statistics Data Return notes that stock ownership by for-profit providers is dominated by just four providers, who own 66% of housing stock. Additionally, in regards to the large increase in low cost home ownership, 800 units, out of the total 945 unit increase between 2017 to 2018, were acquired by one single for-profit provider.
The increase in for-profit providers has raised concern for some, who believe that these organisations acquire social housing without reinvesting any profits back into the sector. However, some may argue that for-profit providers should be viewed as colleagues rather than competitors in the market, since the purpose of their introduction in 2010, was to improve the performance of their non-for-profit counterparts and increase the amount of affordable housing in the country. The recent increase in for-profit providers could therefore be perceived as a step in the right direction in undertaking the task of increasing social housing supply.
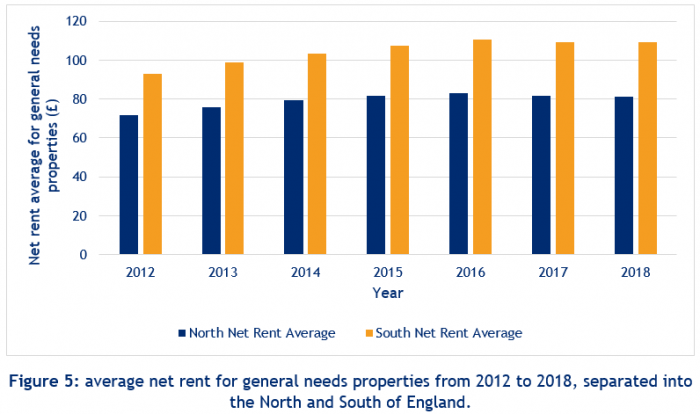
 4. There is a significant disparity between cost of rent for social housing units in the North and South of England.
The disparity between the North and South of England is frequently visible in research conducted by the Regulator of Social Housing. Their recent Repairs and Maintenance Spend review highlighted the location-based cost differences within the sector in relation to repairs spending, with southern organisations spending significantly more. This divide has emerged in this analysis, as shown in Figure five, whereby for PRPs located in southern regions, the net rent for their general needs properties are consistently higher. In 2018, there was a difference of £27.69 per week in average rent between the south and north. PRPs therefore need to be aware that when using this data as a tool to assess the position of the sector as a whole, the actual value for money and efficiency of providers can notably vary depending on their location. It is useful for PRPs, LA’s and local government, to therefore view the LA divided data set alongside the overall trends to gain a broad understanding of the social housing sector.
In Summary
The social housing sector has seen significant, unexpected changes within the past year. As the operating environment becomes restricted by financial cuts, government reforms and new housing policies, PRPs need to become resilient and responsive towards all sector changes. In theory, the 148% increase in the number of units owned by for-profit provider’s means that increased competition in the market should lead to efficiency and value for money improvements in the sector. Yet some many argue that the increase in mergers could be seen as a way some PRPs have already tried to improve VfM by using restructuring as a way of achieving this.
In addition, the 1.1% increase in the amount of social housing stock PRP’s own, shows that government investment and policies have had a positive effect on the housing market. Since the implementation of SOAHP, the expected increase in units/bed spaces owned has materialised, suggesting that government housing policies have influenced the housing sector and reached those whom it was intended for.
In the next year, it is important that the sector continues to grow to meet the ever-increasing demand for social housing. The Statistical Data Return is fundamental for providers and stakeholders to remain confident in the role the regulator plays in the social housing sector.
Pennington Choices offers registered providers a range of advice relating to their housing and management issues, and having worked for over 16 years delivering over 170 consulting projects to social housing landlords nationally, we have significant consultancy experience.
The Statistical Data Return 2017/18 can be found here.
.webp?width=600&height=150&name=Pennington%20Choices%20Logo%20(reduced).webp)


