.webp?width=600&height=150&name=Pennington%20Choices%20Logo%20(reduced).webp)

.webp)


Speak to our team
Looking for support with ensuring the safety and compliance of your buildings? Get in touch with our team of experts.

Share this article
Our Repairs and Maintenance annual spend review serves as a platform for providers to compare how their costs stack up against those of their peers. The data we have used is drawn from the Sector Global Accounts which are released by Homes England (formally the Homes and Communities Agency) and the Regulator of Social Housing annually.
The ability for registered providers to compare their performance to that of comparable organisations can serve as an insightful platform to assess what, if any, internal strategic changes could serve as a potential solution towards ensuring services are delivered in the most efficient manner by becoming more aligned with comparable sector spending. At a time when monetary constraints are increasing along with pressure to evidence cost savings, efficiency is a key component for housing providers to ensure that their own objectives and those of the regulator remain aligned and deliverable.
Since April 2016, providers have seen their rental income reduced, through the rent reduction scheme, which has forced them to think differently about how to improve their bottom line. Therefore, learning from other providers across the sector about their spending and cost base could provide important insight about industry trends.
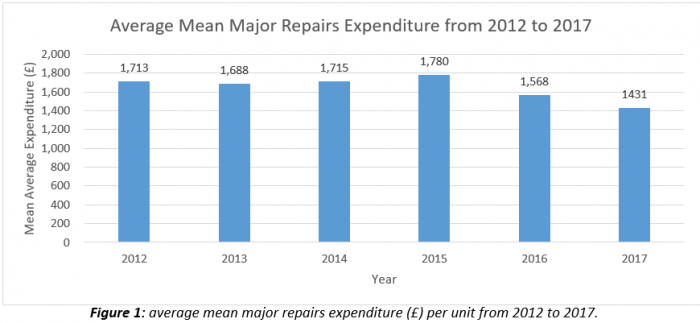
The majority of providers have reduced their expenditure on major repairs in 2017, with average expenditure standing at £1431 per property, a reduction of £137 since 2016. The Regulator of Social Housing suggests this is a consequence of the introduction of rent reduction. As of March 2017, the first year of the 4-year rent reduction period was completed, which enforced a 1% reduction in rent payable by tenants each year on general needs units as stated in the Welfare Reform and Work Act 2016. Providers have therefore responded to this by reducing costs in several areas, including major repairs expenditure, as apparent in Figure 1. In total, this has resulted in a total major repairs spending reduction of 14% in 2017 to £2.1 billion. The Regulator of Social Housing has noted that this reduction will be monitored across the 4 year rent reduction period to ensure that properties continue to be sufficiently maintained to required standards.
Despite this reduction, the regulator predicted in 2016, that the mean major repairs expenditure would reduce by 16% between 2016 and 2020. Figure 1 confirms the general trend prediction; however, a significant reduction of 14% in the period 2016 to 2017 was not anticipated and suggests that if the rate of spending reduction continues the predicted 16% reduction by 2020 will soon be surpassed.
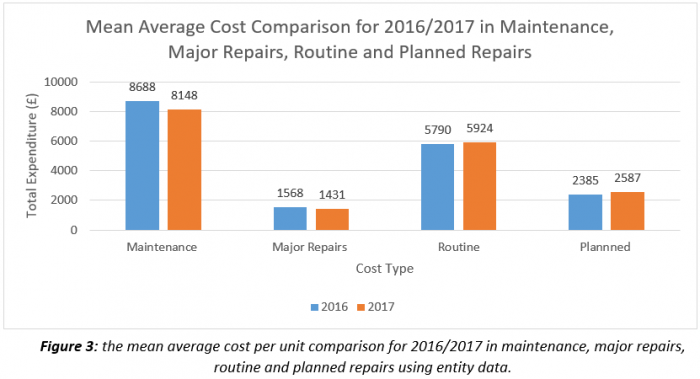
 An increasingly complicated operating environment has meant that aggregation of data has resulted in the concealment of unevenly performing operators with some poorly performing providers being protected within their wider group structures. Despite the appearance of a number of well performing operators, several outliers are not admissible in the review in the amount spent in several areas of repairs and maintenance expenditure. The per property quartiles, in Figure 2, make this disparity visible, particularly within the major repair costs and management costs whereby the majority of the data was located within the upper quartile of the spread. The median average cost, which is not effected by significant outliers, shows a low average major repairs cost of just £520, however the average cost comparison, in Figure 3 for 2016-2017, shows that the mean average, taking into account all outliers, is significantly higher at £1431. It is therefore important to not discount such outliers in data analysis, since the quartile data shows major repair costs as being a minimal part of provider budget.
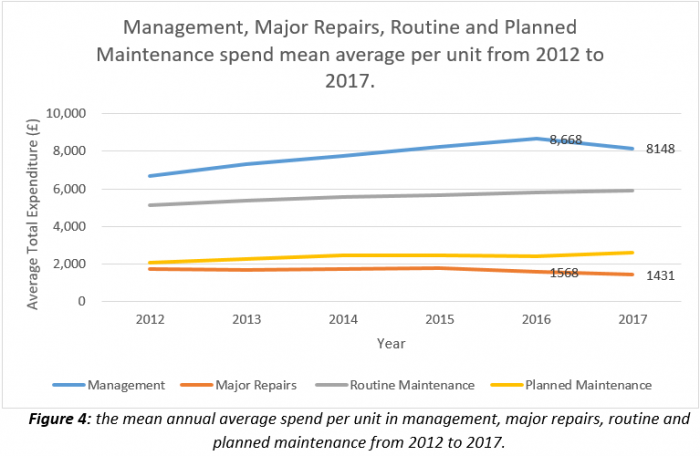
 Our analysis of repair costs can be interpreted further by examining average per unit mean expenditure from 2012 to 2017 in all areas of repairs and maintenance (Figure 4). This allows us to confirm the Regulator of Social Housings statement that providers are reducing costs because of the introduction of the rent reduction scheme. Figure 4 displays the expanding gap between major repairs costs and all other areas of repair spending, with major repairs continuing to reduce, whilst both planned and routine maintenance have increased. To compensate for rent reduction it is also apparent in the graph that management costs have reduced significantly from £8668 to £8148. This is reaffirmed by the total management cost spend reducing by 9% to £2.6 billion.
 The current financial position of all providers suggests that the sector will continue to perform well and develop, despite the remaining 3-years of rent reduction. Even with individual provider performance remaining hidden behind average data analysis, there are concerns that the significant major repair expenditure and management expenditure reduction since 2016 requires the careful monitoring of providers to ensure that they continue to meet standards.

It is important to take into account that providers have varying numbers of units, as displayed in Figure 5. As a result it is more insightful to use the per unit spend as a method of comparison in this analysis. Organisations with a higher number of units understandably have a higher total expenditure in repairs and maintenance therefore it is essential to view the spending per unit in order to understand how different organisations perform comparatively.

Figure 6 displays the 10 organisations with the lowest headline Costs per unit (CPU) and the 10 organisations with the highest headline costs per unit (CPU). As an additional comparison, the organisations have been separated into their location; North and South. It is apparent from this that there is a cost divide between northern and southern providers, since 7 out of the 10 lowest CPUs are from Northern organisations whilst just 4 of the highest CPUs are based in the North.
Additionally, the highest spend is 25.8 (£k) per unit, notably from a southern organisation, whilst the lowest is just 1.9 (£k) per unit, from a northern organisation. These outliers, whilst taken into account when calculating mean average spend, are essentially hidden behind average mean calculations, therefore it is important to highlight these when analysing the Global Accounts of Registered Providers.
The apparent cost divide between the North and South is also a notable feature of Figure 6. Cost comparisons such as this can be used as a tool to provide an insight for organisations to establish their position in the market. A significantly higher spend in particular areas of maintenance and repairs can display an area where value for money is not being delivered by an organisation, and could suggest an area of performance that should be reviewed. However, it is important that organisations take into account location based cost differences when comparing their performance to others, as it is still evident that southern organisations spend more per unit on repairs and maintenance than northern organisations.
As specialist housing consultants, Pennington Choices provides value for money repair reviews to help housing providers improve the financial efficiency of their repairs services. To learn more, please email Jenny Neville.
The 2017 global accounts of private registered providers can be found here.