.webp?width=600&height=150&name=Pennington%20Choices%20Logo%20(reduced).webp)

.webp)


Speak to our team
Looking for support with ensuring the safety and compliance of your buildings? Get in touch with our team of experts.

Share this article
Our repairs and maintenance annual spend review will enable social housing providers to compare their costs against their peers. The data we have used is drawn from the 2018 Global Accounts of private registered providers and the 2018 Global Accounts annex – Value for Money metrics, which are annual publications released by the Regulator of Social Housing.
Being able to evaluate and compare performance to similar organisations can serve as an insightful platform for social housing providers and enable them to assess potential strategic changes that could be implemented to ensure services are delivered appropriately and efficiently. At a time when monetary burdens are increasing, and there is pressure to evidence cost savings, efficiency is a key component for housing providers to ensure that their own objectives, and those of the Regulator, remain aligned and deliverable.
Therefore, reviewing and learning from other providers across the sector, about their spending and cost base, could provide an important understanding and awareness of industry trends.
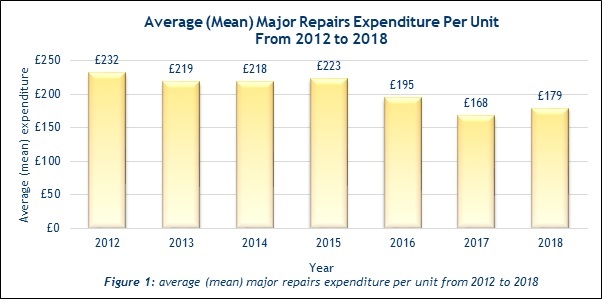
Since April 2016, providers have seen their rental income reduced, through a 1% reduction in rent payable by tenants each year on general needs units (the rent reduction scheme), as stated in the Welfare Reform and Work Act 2016. The year ending March 2018 was the second year of the rent reduction scheme, and for the first time in 2018, providers were also required to reduce rents on most supported housing properties. The rent reduction scheme has forced providers to think differently about how to improve their bottom line; indeed, in 2016 and 2017, the majority of providers responded by scaling back overall spend, including cutting their expenditure on major repairs. This is highlighted in Figure 1, where major repairs expenditure was £195 and £168 per unit in 2016 and 2017 respectively, a considerable reduction from spend in 2015 (£223).
However, this trend has not continued into 2018 where there has been a marked increase in average (mean) spend on major repairs per unit, up by £11 since 2017 to £179. This departure from reducing spend could be partly attributed to providers’ strategic focus on achieving efficiencies prior to 2018 (across all organisational directorates) and the implementation of financial and business planning models in response to the rent reduction scheme. Now that providers have anticipated and planned for the impact of rent reductions, it may be fair to deduce that they are more comfortable about investing in major repairs.
Another contributing factor to the increase in major repairs expenditure, could be the increase in the total value of housing assets held by the sector, which increased by £7.2 billion to £156.2 billion in 2018 (with £150.6 billion attributable to properties held for social rent and investment properties).
The charts below illustrate average per provider expenditure for management costs, routine repairs, planned maintenance and major repairs in 2018.
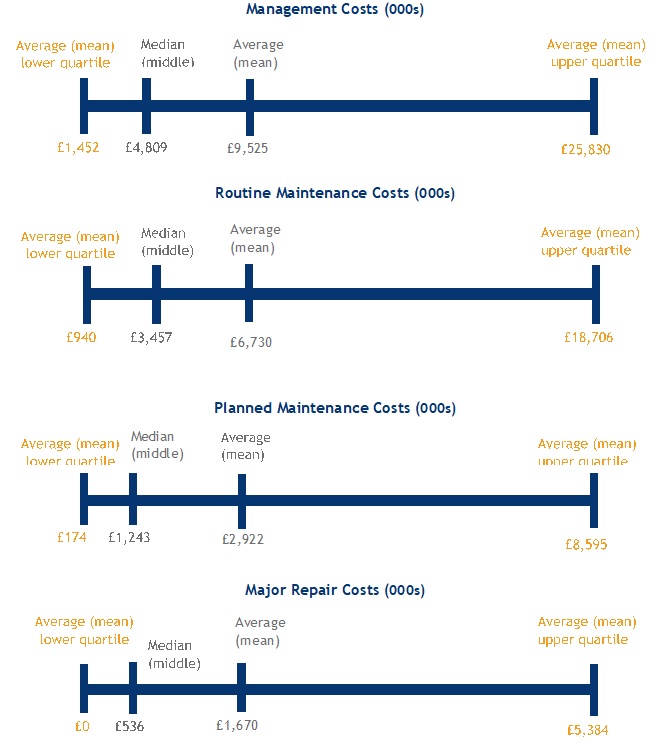

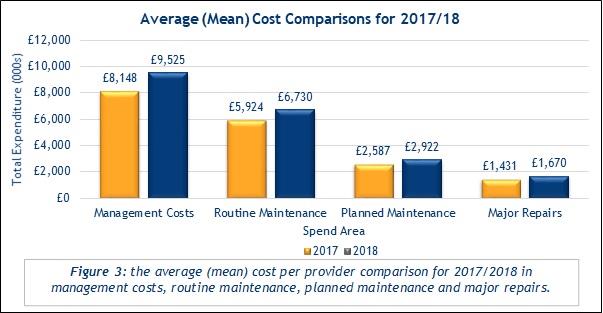
Owing to an increasingly complicated operating environment, the aggregation of data often results in the concealment of some poorly performing providers being protected within their wider group structures. Despite the appearance of a number of well performing providers, several outliers can distort the average (mean) figures of expenditure on management, maintenance and repairs costs and therefore, providers should take this into consideration when reviewing this data. The per provider quartiles (Figure 2) make this disparity visible, particularly within the major repair costs and management costs, where the upper quartile is significantly higher than the median expenditure. The median (middle) cost, which is not affected by significant outliers, shows a low major repairs cost of £536,000. However, Figure 3 shows that the average (mean), taking all outliers into account, is significantly higher at £1,670,000 for 2018. Therefore, it is important not to discount such outliers in data analysis, since the quartile data shows the extent to which providers consider each area expenditure relative to their overall budget.
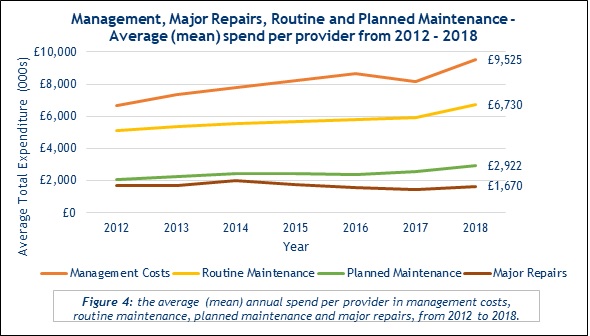
Our analysis of management, maintenance and repair costs can be interpreted further by examining the average (mean) per provider expenditure from 2012 to 2018 (Figure 4). This displays that despite the 1% rent reductions being effective for two years, there is a general increase in spend across all areas from 2017 to 2018. Figure 4 also highlights the gap between routine maintenance expenditure and major repairs and planned maintenance expenditure, with routine maintenance always more than double the cost of both.
Interestingly, management costs have increased significantly from an average (mean) per provider of £8,148,000 in 2017 to £9,525,000 in 2018, a 16.9% increase. Management costs include staffing costs and IT support, and are generally higher in providers that own and manage supported and older people’s housing. Many of the providers we work with face significant data challenges, and as a result are investing in their IT and data management systems. Not only does this enable them to benefit from advancements in the wider technological and digital environments, it is also essential for effective management and reporting of important data, such as legislative compliance data. Furthermore, providers are driving towards paperless working environments and therefore the capabilities of their online storage systems are more important than ever.
The current financial position of all providers suggests that the sector will continue to develop and perform well, despite the remaining two years of rent reduction. This is clearly evidenced by the increase in spending across all areas subject to review from 2017 to 2018. However, even with this perceived confidence in their financial standing, providers must continue to carefully monitor management, repairs and maintenance expenditure to ensure that they continue to meet the required standards.
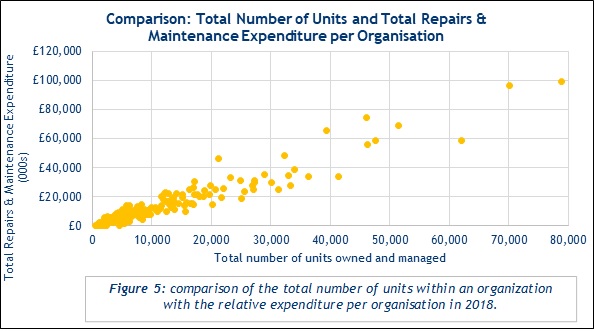
It is important to take into account that providers have varying numbers of units, as displayed in Figure 5, and following the results from the 2018 accounts, the Regulator recognises that there is no clear-cut correlation between the performance and the size of providers. Notwithstanding this, organisations with a higher number of units understandably have a higher total expenditure on repairs and maintenance, therefore it is essential to view the spending per unit in order to understand how different organisations perform comparatively. The number of units providers own ranges from 589 to 78,854, with the majority of providers owning between 500 and 20,000 and spending on repairs and maintenance between £1000 and £20,000 per unit, as shown in Figure 5. For purposes of this analysis Clarion Housing, the largest provider with 108,628 units, has been excluded from these results as an outlier.
Previously, providers have had to produce a Value for Money self-assessment for the Regulator, however, on 1 April 2018, a new Value for Money (VfM) Standard came into effect, which requires providers to report against and publish seven VfM metrics as specified by the Regulator. This new approach brings an increased focus on driving improvements in VfM across the sector and an emphasis on quantifiable outcomes. As a result, it is possible that this greater scrutiny has increased providers’ awareness of their spending habits and forced them to be candid about what their strategic priorities should be.
Headline social housing costs form part of the annual VfM metrics that providers have to publish as part of the VfM Standard. As 2018 is the first year providers have submitted reporting in this way, given that there are some inconsistencies in individual provider’s reporting, the Regulator has advised that caution should be exercised when interpreting the data. The Regulator has warned that providers must report on a consistent basis, and in line with the calculations set out in the technical note, in order to support comparability across the sector and to help the Regulator identify where further regulatory engagement might be required. With regards to headline social housing costs, disparities have mainly arisen from providers excluding certain types of social housing (e.g. supported housing).
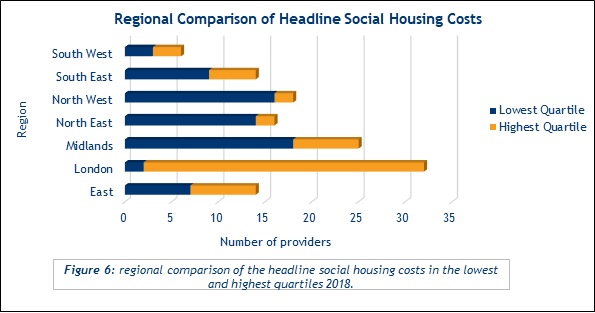
Notwithstanding this, this data can still be a useful tool for comparative analysis since headline social housing costs comprise of a range of different costs including; management, service charge, repairs and maintenance, development services, community and neighbourhood services and charges for support services. Figure 6 displays the lowest and highest quartiles of the headline social housing costs per unit (CPU) by region. As we would expect, those providers with the highest headline social costs have units within the London region.
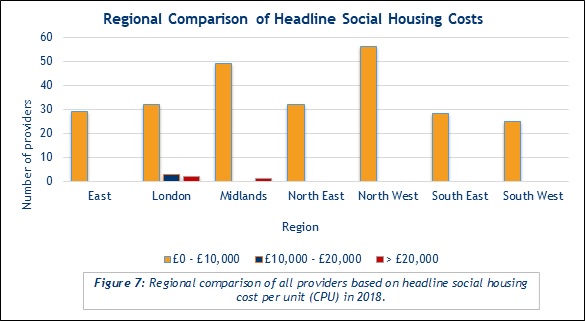
As can be seen from Figure 7, the majority of providers across all regions spend up to £10,000 per annum on headline social housing costs per unit. The only exceptions to this, are a handful of providers that operate in London and Midlands regions, who are spending more than £10,000 per unit, with Look Ahead Care and Support Limited spending the most at £24,100 per unit. The median headline social housing costs rose from £3,290 per unit in 2017 to £3,400 in 2018, with an overall average (mean) of £4,200 per unit, as a result of the increases in management and maintenance expenditure, as identified above.
A significantly higher spend in particular areas of maintenance and repairs can display an area where value for money is not being delivered by an organisation, and could suggest an area of performance that should be reviewed. However, it is important that organisations take into account location based cost differences when comparing their performance to others, as southern providers spend more per unit on repairs and maintenance than providers based in other regions around the country.
In the main, the economic operating environment for providers was stable in the year 2018, however, given the levels of uncertainty over the terms of the UK’s departure from the European Union, providers should be prepared and equipped for unfavourable economic conditions. In addition, providers must keep control over the continuing impact of rent reductions and inflation on their costs for healthy margins and surpluses to be maintained.
Providers should know and understand their costs per unit in relation to management costs, routine maintenance, planned maintenance and major repairs and have an effective governance arrangement in place to make appropriate decisions that impact CPU relative to their strategic objectives.
The 2018 global accounts of private registered providers can be found here.